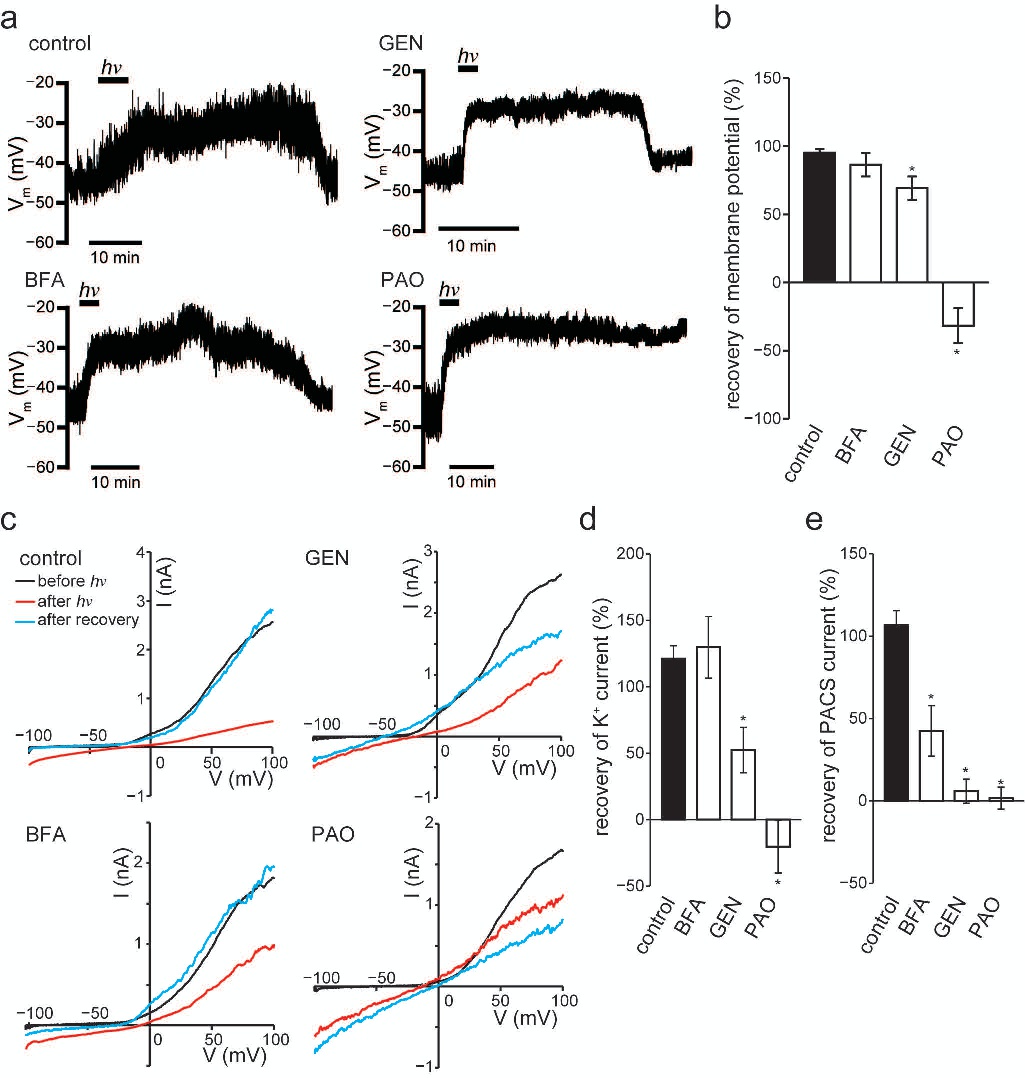
Fig. 6. Endocytic membrane retrieval involved in the recovery of photo-induced depolarization in PC12 cells. (a) Representative trace of time-dependent changes in the membrane potential under 4-min of illumination (black bar, hν: 525−550 nm, input power 2 mW cm−2) are shown for PC12 cells treated with brefeldin A (BFA), genistein (GEN), and phenylarsine oxide (PAO). (b) The average of the membrane potential recovery. *p<0.05 vs. control (n = 5-7). (c) Representative I−V curves under 4-min of illumination (hν: 525−550 nm, input power 2 mW cm−2) are shown for PC12 cells treated with TC1-loaded cpHDL. The black, red, and blue curves in (c) were collected at the time points before hν, after hν, and after recovery. (d) The average of the recovery of K+ currents from photo-induced depolarization at +100 mV. *p<0.05 vs. control (n = 5-7). (e) The average of the recovery of PACS currents from photo-induced depolarization at -100 mV. *p<0.05 vs. control (n = 5-7).